BI Export Menu
The BI Export feature in @RISK allows you to export simulation results directly from Excel to a structured database file. This file can then be used in Power BI or other Business Intelligence tools to build interactive dashboards and visualize simulation outcomes, sensitivities, and key statistics.
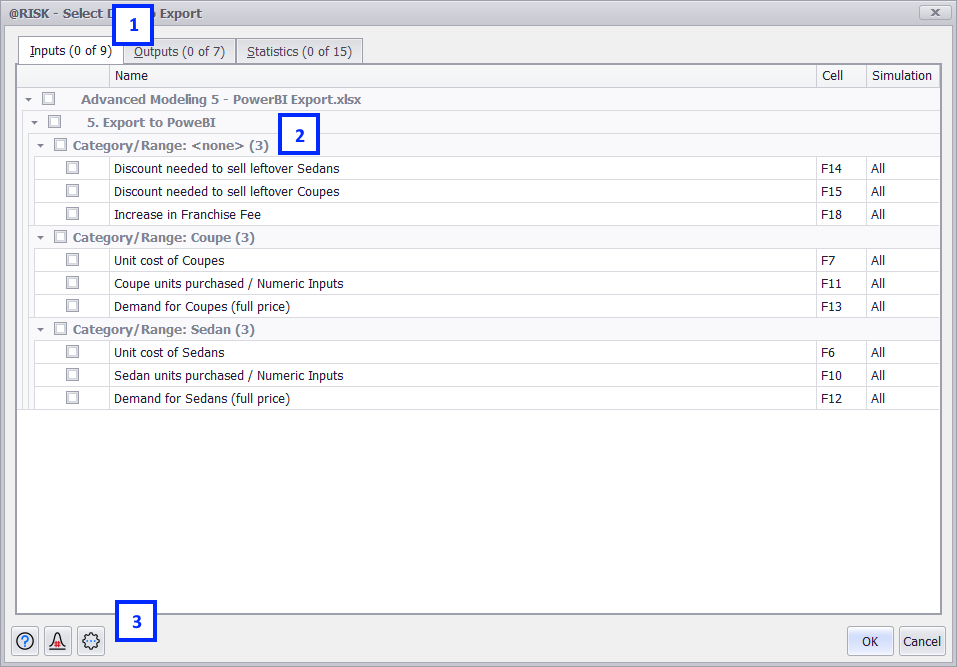
Figure 1 - Select Data to Export
Select Data to Export
The Select Data to Export window provides an overview of all @RISK elements that are part of the open model. The window is organized into three tabs—Inputs, Outputs, and Statistics—each displaying a specific type of @RISK element. This interface allows you to select which elements to include in the exported dataset.
The Select Data to Export window includes the following primary components:
-
Model Elements Type Tabs – Displays the Inputs, Outputs, and Statistics available for export. Details the number of selected elements out of the total.
-
Model Element List – Lists all @RISK elements with individual and group checkboxes for selection.
-
Command Buttons – Provides access to additional options, actions, and help resources.
When multiple @RISK workbooks are open, the window displays all variables from every open workbook and worksheet that contains an @RISK function.
By default, variables from each workbook are grouped under collapsible headers indicating the Excel workbook name and the worksheet name.
The Inputs tab lists all input variables defined across all open workbooks. Inputs may include distributions, time series, RiskMakeInput, and RiskSimTable functions. You can select inputs individually or by group using the Group Rows By option.
When an input is selected, @RISK exports the input information and all iteration values for the selected variables. These values are written to the Inputs and InputData tables in the exported database file. (See Database File Structure for details.)
The Outputs tab lists all output functions defined in the open workbooks. Outputs represent the calculated results of the simulation that are used for analysis and decision-making.
When an output is selected, @RISK exports the output information and all iteration values for the selected variables. These results are written to the Outputs and OutputData tables in the database file.
If multiple simulations are available, the Simulation column indicates which simulation results will be exported. By default, All Simulations are selected, but you can specify a single simulation if desired.
The Statistics tab contains all statistics and sensitivity results available for export from @RISK.
The Statistical section includes a set of commonly used summary statistics, such as mean, minimum, maximum, standard deviation, and percentiles. When one or more of these options are selected, @RISK will calculate and export the corresponding values for each selected input and output. These results are stored in the InputStatistics and OutputStatistics tables within the exported database file. All the Statistics information is exported to the Statistics table.
To specify which percentiles to export, select the Percentiles option. By default, @RISK includes all percentiles defined in the Percentiles Preferences. Any changes made to the selected percentiles apply only to the current export session and are not saved for future exports.
The Sensitivity section provides options to export sensitivity results for all outputs defined in the model. Available options include Change in Output Statistic, Regression Coefficients, Correlation Coefficients, and Contribution to Variance. Selecting these options exports the calculated sensitivity measures for all selected outputs. This information can be used to build tornado charts and other visuals that illustrate the relative impact of each input on a given output.
The Change in Output Statistic option uses the statistic defined in the Sensitivity Preferences section of the Tornado Graphing Preferences.
When a sensitivity option is selected, @RISK exports the related input information for all inputs influencing the selected outputs to the Inputs table, and the calculated sensitivity results to the OutputSensitivities table. Note that @RISK will export input information even if no input variables have been selected separately. Detailed input iteration data, however, will only be included if inputs are explicitly selected in the Inputs tab.
Model Command Buttons
The Command Buttons for Select Data to Export window include:
 Help - Open help resources; see Help Button for more information.
 Select Simulation # to Display - This option is available only when the simulation results include multiple simulations. Use it to switch between simulations and select a single simulation to export, or choose All Simulations to include all available results. The selection is displayed in the Simulation column of the Inputs and Outputs tabs.
 Settings/Actions - Window-specific settings and actions. The Select Data to Export List options are:
-
Group Rows By – Controls how elements are organized within the Select Data to Export list when viewing multiple workbooks or worksheets, or when inputs and outputs have assigned categories or ranges. Grouping can be turned on or off for each level.
-
Workbook – When selected, all elements from a workbook are nested under a collapsible heading labeled with the workbook name. When cleared, the workbook name appears as a column in the list.
-
Worksheet – When selected, all elements from a worksheet are nested under a collapsible heading labeled with the worksheet name. When cleared, the worksheet name appears as a column in the list.
-
Category/Range – When selected, all inputs or outputs assigned to a specific category or range are nested under a collapsible heading labeled with the category or range name. Elements without a defined category or range are grouped under <none>. When cleared, the category or range name appears as a column in the list.
-
-
Collapse - Collapse the lists of inputs, outputs, statistics or sensitivities to the first grouping level. All containers will be collapsed to hide their contents.
-
Expand - Expand the lists of inputs, outputs, statistics or sensitivities . All containers will be expanded to show their contents.
-
Find - Open the Find panel (Figure 1, below) at the top of the active tab to search for inputs or outputs.
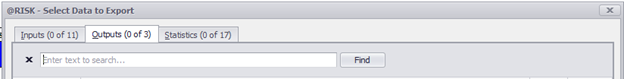
Figure 1 – Select Data to Export - Find Panel